My app required me to create a few simple donut graphs (and one much more complicate graph). I don't think I've ever made a chart like this before but I knew I wanted to make it as an SVG. I found the open source chartist.js (https://gionkunz.github.io/chartist-js/), which has good documentation and the charts look pretty good, so I used that as my basis.
I wanted to create this:
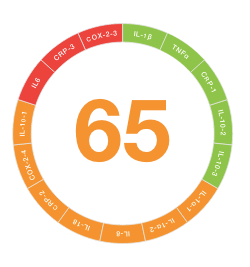
This is a donut chart representing a collection of codes, with a value assigned to the collection. The codes are colour coded to represent their value (of of three possible ranges of values), with the overall value being displayed in the center of the donut graph.
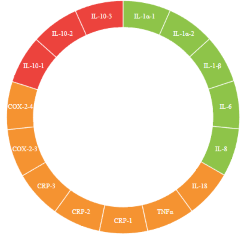
This can almost entirely be done using the standard Chartist.Pie chart, with the donut option set to true. The chart can take a data set (series) and a set of labels associated with each value in the series. The only problem is the labels are displayed horizontally, from the center of each slice of the donut.
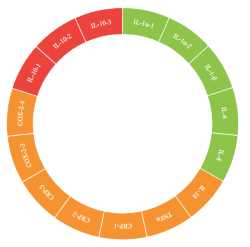
My plugin hooks into the graphs "draw" event and when each slice is created, it creates a simple arc path and places that path in defs. When the "draw" event is raised for the label, I modify the newely created text element and add a textPath that references the arc path created previously. This draws the label along the arc. Perfect.
To make your labels curve along the donut all you need to do is add the plugin to the options you pass when you create the graph and you end up with curved labels:
var curvedOptions = {
        donut: true,
        donutWidth: 45,
        donutSolid: true,
        startAngle: 0,
        showLabel: true,
        width: 400,
        height: 400,
        plugins: [
          Chartist.plugins.curvedDonutLabels(),
        ]
      };

new Chartist.Pie("#donutCurvedLabels", donutData, curvedOptions);
If you're interested, check out the project on my github.
(Note: I made a separate plugin to create a text item that gets displayed at the center of the donut)